In this project, we clean, explore, and visualise insurance premium data in python using jupyter notebook. Open- source library such as Pandas
, Numpy, Seaborn and matplotlib are used to clean and plot data. SQL was also used to explore data.

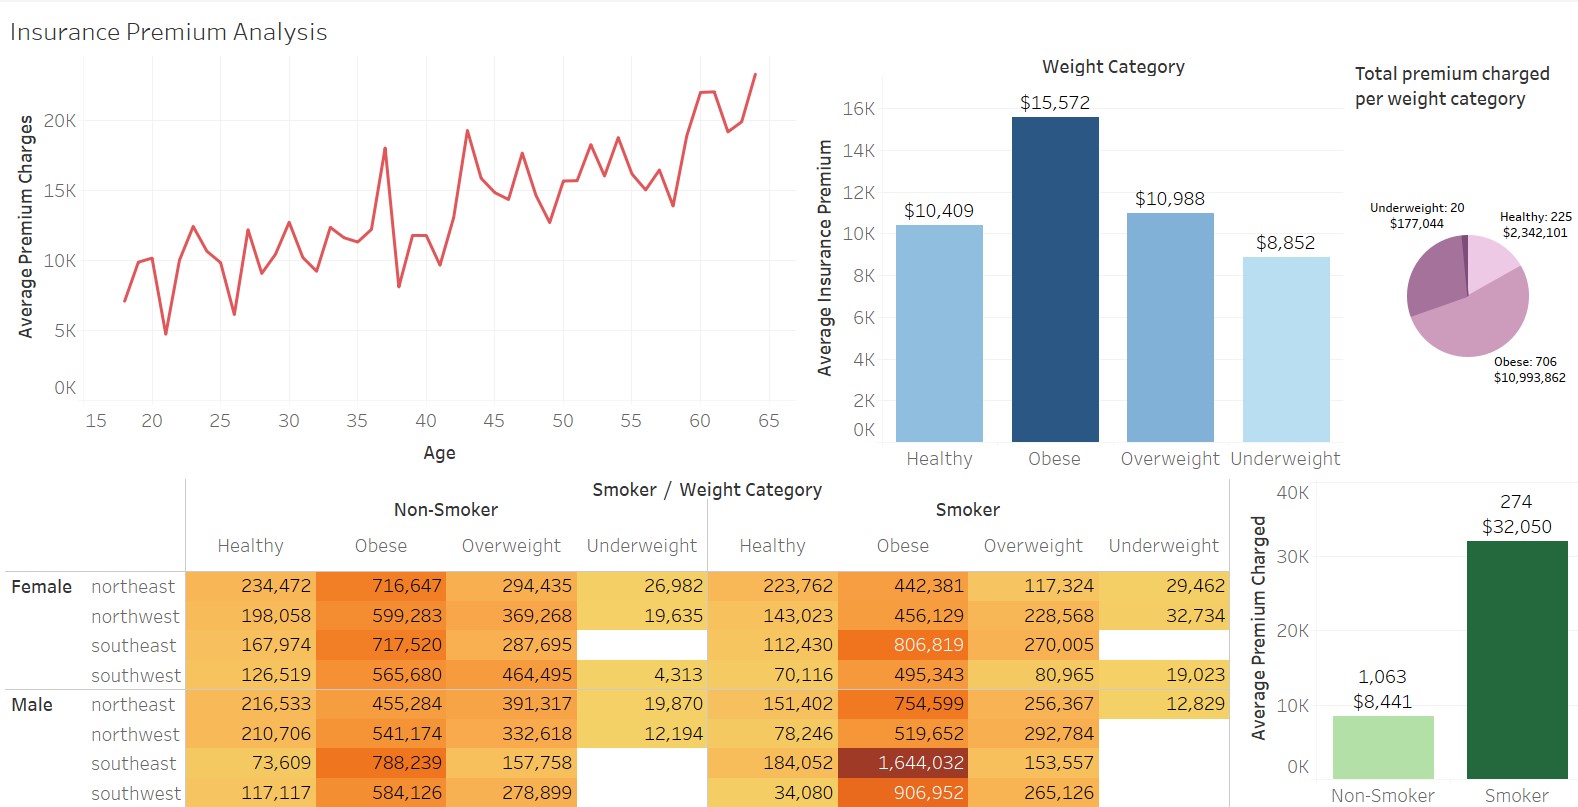
Visualise insurance premium data using tableau. A dashboard is created to summarise multiple visualisations. These visualisations are linked together to produce an interactive dashboard which enables filtering.

In this project, we clean, explore, and visualise Airbnb Los Angeles data in R using Rstudio. R packages such as Tidyverse ,
Skimr, Janitor, Dplyr and ggplot2 are used to clean and plot data. SQL was also used to explore data.
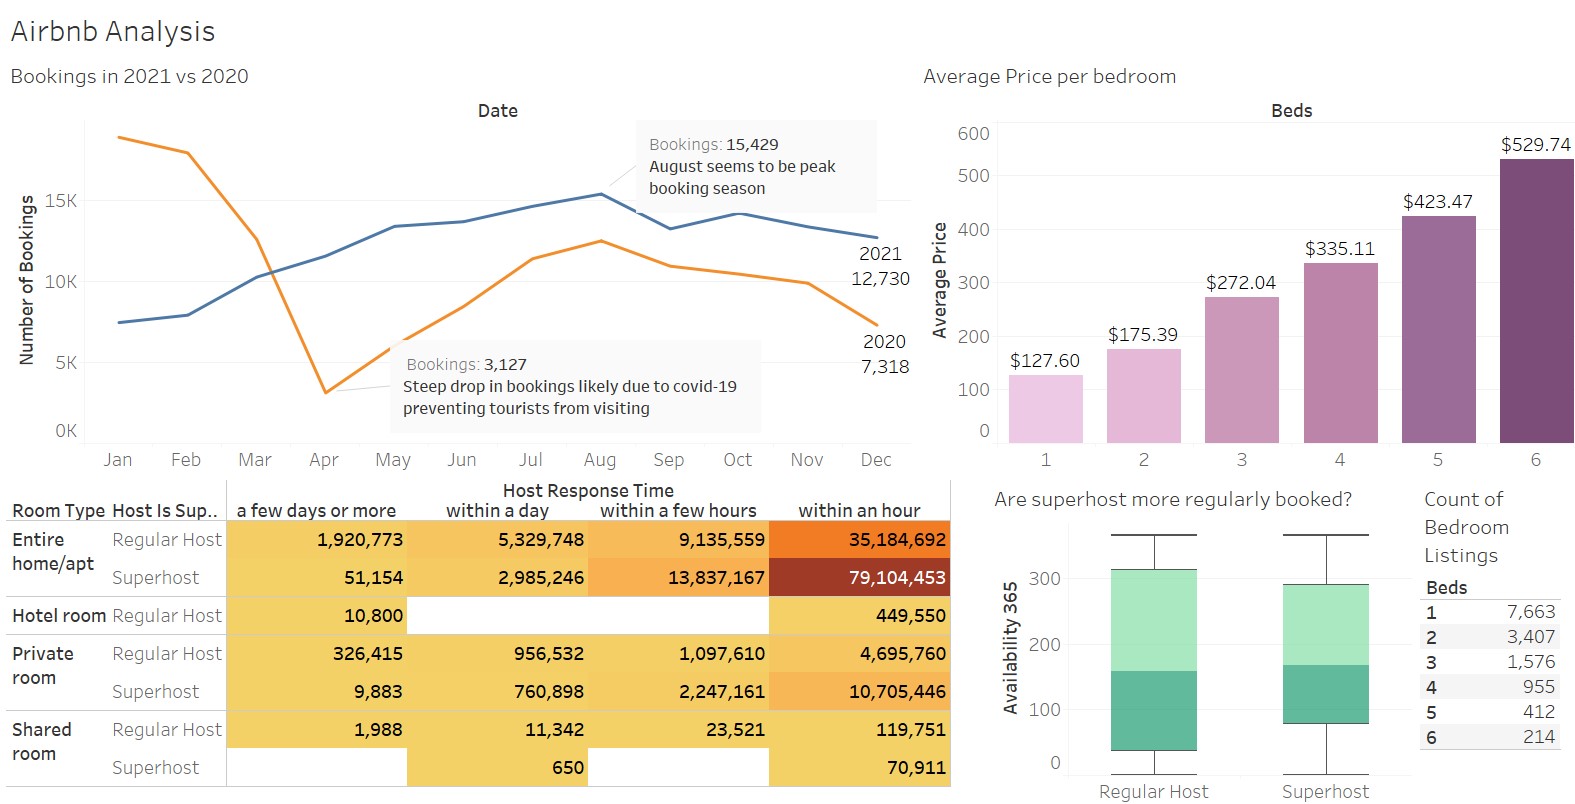
Visualise Airbnb LA data using tableau. A dashboard is created to summarise multiple visualisations. These visualisations are linked together to produce an interactive dashboard which enables filtering.
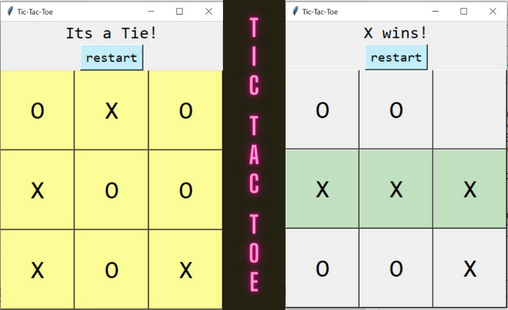
Created a Tic-Tac-Toe game using Python. Packages used include tkinter and random. Random functions are used to
randomly generate X or O first. When there is a tie, all spaces will turn yellow. On the other hand, when there is
a winner, it will turn green. For loops were also used to create the 3 by 3 grid.
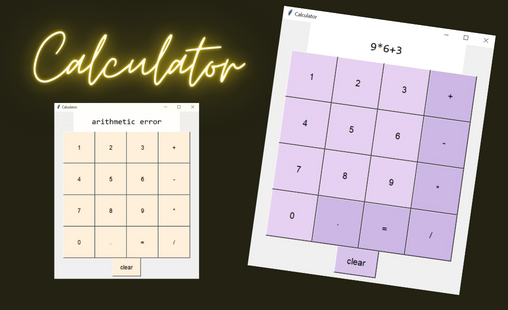
Created a calculator using python. eval function are used to calculate expression. A display of arithmetic error is shown when there
is a zero division error. For loop function was also used to generate numbers 1 to 9. A clear button
was created to clear expressions.

Coming Soon...